
It always used to be a stock joke in my old workplace that if you were having a tough time finding issues in a pentest then you could always rely on “TCP/IP timestamps”. Recently I did a re-test (based on another company’s report) that included this issue and found that it’s easy for this to be a false positive. I thought I’d write up this finding – as much for the journey I took through Nessus, Nmap, hping and Wireshark as for the result itself.
What are these timestamps anyway?
Timestamps are an optional addition to the TCP layer to provide information on round-trip times and to help with sequencing – see RFC 1323. The side-effect of supporting TCP timestamps (I’ll drop the IP now) is that in certain situations the uptime of the server can be estimated. The most likely impact of this is that an attacker could try to determine the host’s patch status as certain updates require a reboot.
The report I was re-testing had TCP timestamps as an issue – and you could tell it was a straight Nessus finding. I decided that, if timestamps were indeed enabled, I would at least try to find the uptime and make some comment on it.
Testing with Nessus and Nmap
I ran a Nessus scan and sure enough it reported “TCP/IP Timestamps Supported” but it didn’t state any estimated uptime. I then ran Nmap with -O and -v but it didn’t report anything either. In Nmap’s help for OS detection it states that:
The uptime guess is labeled a “guess” because various factors can make it completely inaccurate. Some operating systems do not start the timestamp counter at zero, but initialize it with a random value, making extrapolation to zero meaningless. Even on systems using a simple counter starting at zero, the counter eventually overflows and wraps around. With a 1,000 Hz counter increment rate, the counter resets to zero roughly every 50 days. So a host that has been up for 102 days will appear to have been up only two days. Even with these caveats, the uptime guess is accurate much of the time for most operating systems, so it is printed when available, but only in verbose mode. The uptime guess is omitted if the target gives zeros or no timestamp options in its SYN/ACK packets, or if it does not reply at all. The line is also omitted if Nmap cannot discern the timestamp increment rate or it seems suspicious (like a 30-year uptime).
I’ve bolded the important bits: firstly, remember to add -v to display any timestamp information; secondly, there are a number of reasons why Nmap might have omitted it. I came across this article which talks about adding the -d switch to debug the time calculation. The output from this article was:
root@tester# nmap -d -v -O victim.com

Starting Nmap 5.51 ( http://nmap.org ) at 2012-09-28 10:07 EDT

Initiating OS detection (try #1) against 1.2.3.4

OS detection timingRatio() == (1348841228.595 – 1348841228.095) * 1000 / 500 == 1.000

Retrying OS detection (try #2) against 1.2.3.4

OS detection timingRatio() == (1348841231.064 – 1348841230.563) * 1000 / 500 == 1.002

...[and more of the same]...
In fact this took me down a dead-end. After some head scratching I realised that those timingRatio() lines don’t relate to the uptime calculation. Timestamp values are whole numbers and there’s no time unit attached to them. According to the RFC the “timestamp clock…must be at least approximately proportional to real time” and it recommends “a timestamp clock frequency in the range 1 ms to 1 sec per tick”. In the output above 1348841228.595, for example, is in fact an Epoch time (seconds since 1 Jan 1970) and is equal to Fri, 28 Sep 2012 14:07:08 GMT. Since GMT=EDT+4 you can see this time is exactly when the scan was run. A comment in Nmap’s source code (osscan2.cc) for the function timingRatio() explains the debug line: “Compute the ratio of amount of time taken between sending 1st TSEQ probe and 1st ICMP probe compared to the amount of time it should have taken. Ratios far from 1 can cause bogus results”. So although Nmap’s online help was giving reasons why the uptime wasn’t being reported, debugging wasn’t telling me why.
Manual testing: hping and Wireshark
One thing I did get from the article above was how to fire off a packet to elicit a TCP timestamp response:
hping3 www.example.com -p 80 -S --tcp-timestamp -c 1

  hping3   a network packet generator and analyser

  -p   an open port on the target

  -S   set the SYN flag

  --tcp-timestamp   add the TCP timestamp option

  -c 1   stop after receiving 1 response packet
Top tip: if you’re using hping in a VM, make sure the network interface isn’t set to NAT on a host that has TCP timestamps disabled (like my Win7 box) – it will waste at least 20 minutes of your life! Anyway, the response to my hping included:
TCP timestamp: tcpts=0
Now I had a theory. The server was responding with a TCP timestamp value, which made Nessus report it, but Nmap didn’t report the uptime because the value was 0. Of course there is a chance that the timestamp could be 0 but certainly not for two consecutive replies. If you do get a non-zero value, by the way, you can run 2 hpings separated by “sleep” to calculate the tick rate and then estimate the uptime:
hping3 www.example.com -p 80 -S --tcp-timestamp -c 1; sleep 5; hping3 www.example.com -p 80 -S --tcp-timestamp -c 1
Taking tcpts[0] to be the first timestamp reply and tcpts[1] to be the second, the uptime in seconds is:
tcpts[0] / ( ( tcpts[1] - tcpts[0] ) / 5 )
Or in words: subtract the first timestamp value from the second, divide by 5 and then divide that result into the first timestamp.
For completeness I thought I’d find the packets in Wireshark:
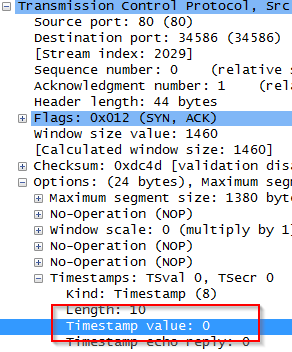
The timestamp option in a TCP packet contains two values: TSval (the source’s time) and TSecr (an echo of the time the destination last sent). The best filter I found to look for positive timestamps was ip.src == <IP_of_target> && tcp.options.timestamp.tsval && !(tcp.options.timestamp.tsval == 0). The second part ensures that a TSval value is there since the third will return TRUE if the field isn’t there as well as when it’s non-zero. In this case, the filter returned no packets, as expected.
Back to Nessus
The following is a compressed extract of the relevant code from the Nessus plugin tcp_timestamps.nasl (version 1.19, latest at time of writing):
function test(seq) { ...

tsval = tcp_extract_timestamp(pkt["options"]);

if (isnull(tsval)) return NULL;

return make_list(ms, tsval);

}

...

v1 = test(seq:1);

sleep(1);	# Bigger sleep values make the test more precise

v2 = test(seq: 2);

dseq = v2[1] - v1[1];

# Disable the uptime computation (unreliable)

if ( TRUE || dseq == 0 || v2[1] < 0)

{

  security_note();

}

[else calculate and print uptime]
So Nessus reported the issue just because a TSval field was returned (it wasn't NULL), hence the false positive. For Nessus, an individual timestamp of 0 isn't a concern (which you could argue is justified) but if the difference between two timestamps is 0 then no uptime is computed. However, you can see that the TRUE that precedes this check effectively disables the uptime calculation completely, as the comment notes.
Conclusion
If Nessus reports TCP timestamps, it might not be a valid finding - and even if it is you won't get an uptime; if Nmap doesn't report it, there's probably a good reason. To be absolutely sure, hping can be used for a definitive test (along with Wireshark if you like to see your packets raw). My final word has to be this: I can't believe I've spent this much time on TCP timestamps.
or we can do
hping3 -S -c 2 -p –tcp-timestamp
Timestamp Echo Reply (TSecr). 32 bits.
This field is only valid if the ACK bit is set in the TCP header. If it is valid, it echos a timestamp value that was sent by the remote TCP in the TSval field of a Timestamps option. When TSecr is not valid, its value must be zero. The TSecr value will generally be from the most recent Timestamp option that was received; however, there are exceptions that are explained below. A TCP may send the Timestamp option in an initial SYN segment (i.e., segment containing a SYN bit and no ACK bit), and may send a TSopt in other segments only if it received a TSopt in the initial SYN segment for the connection.